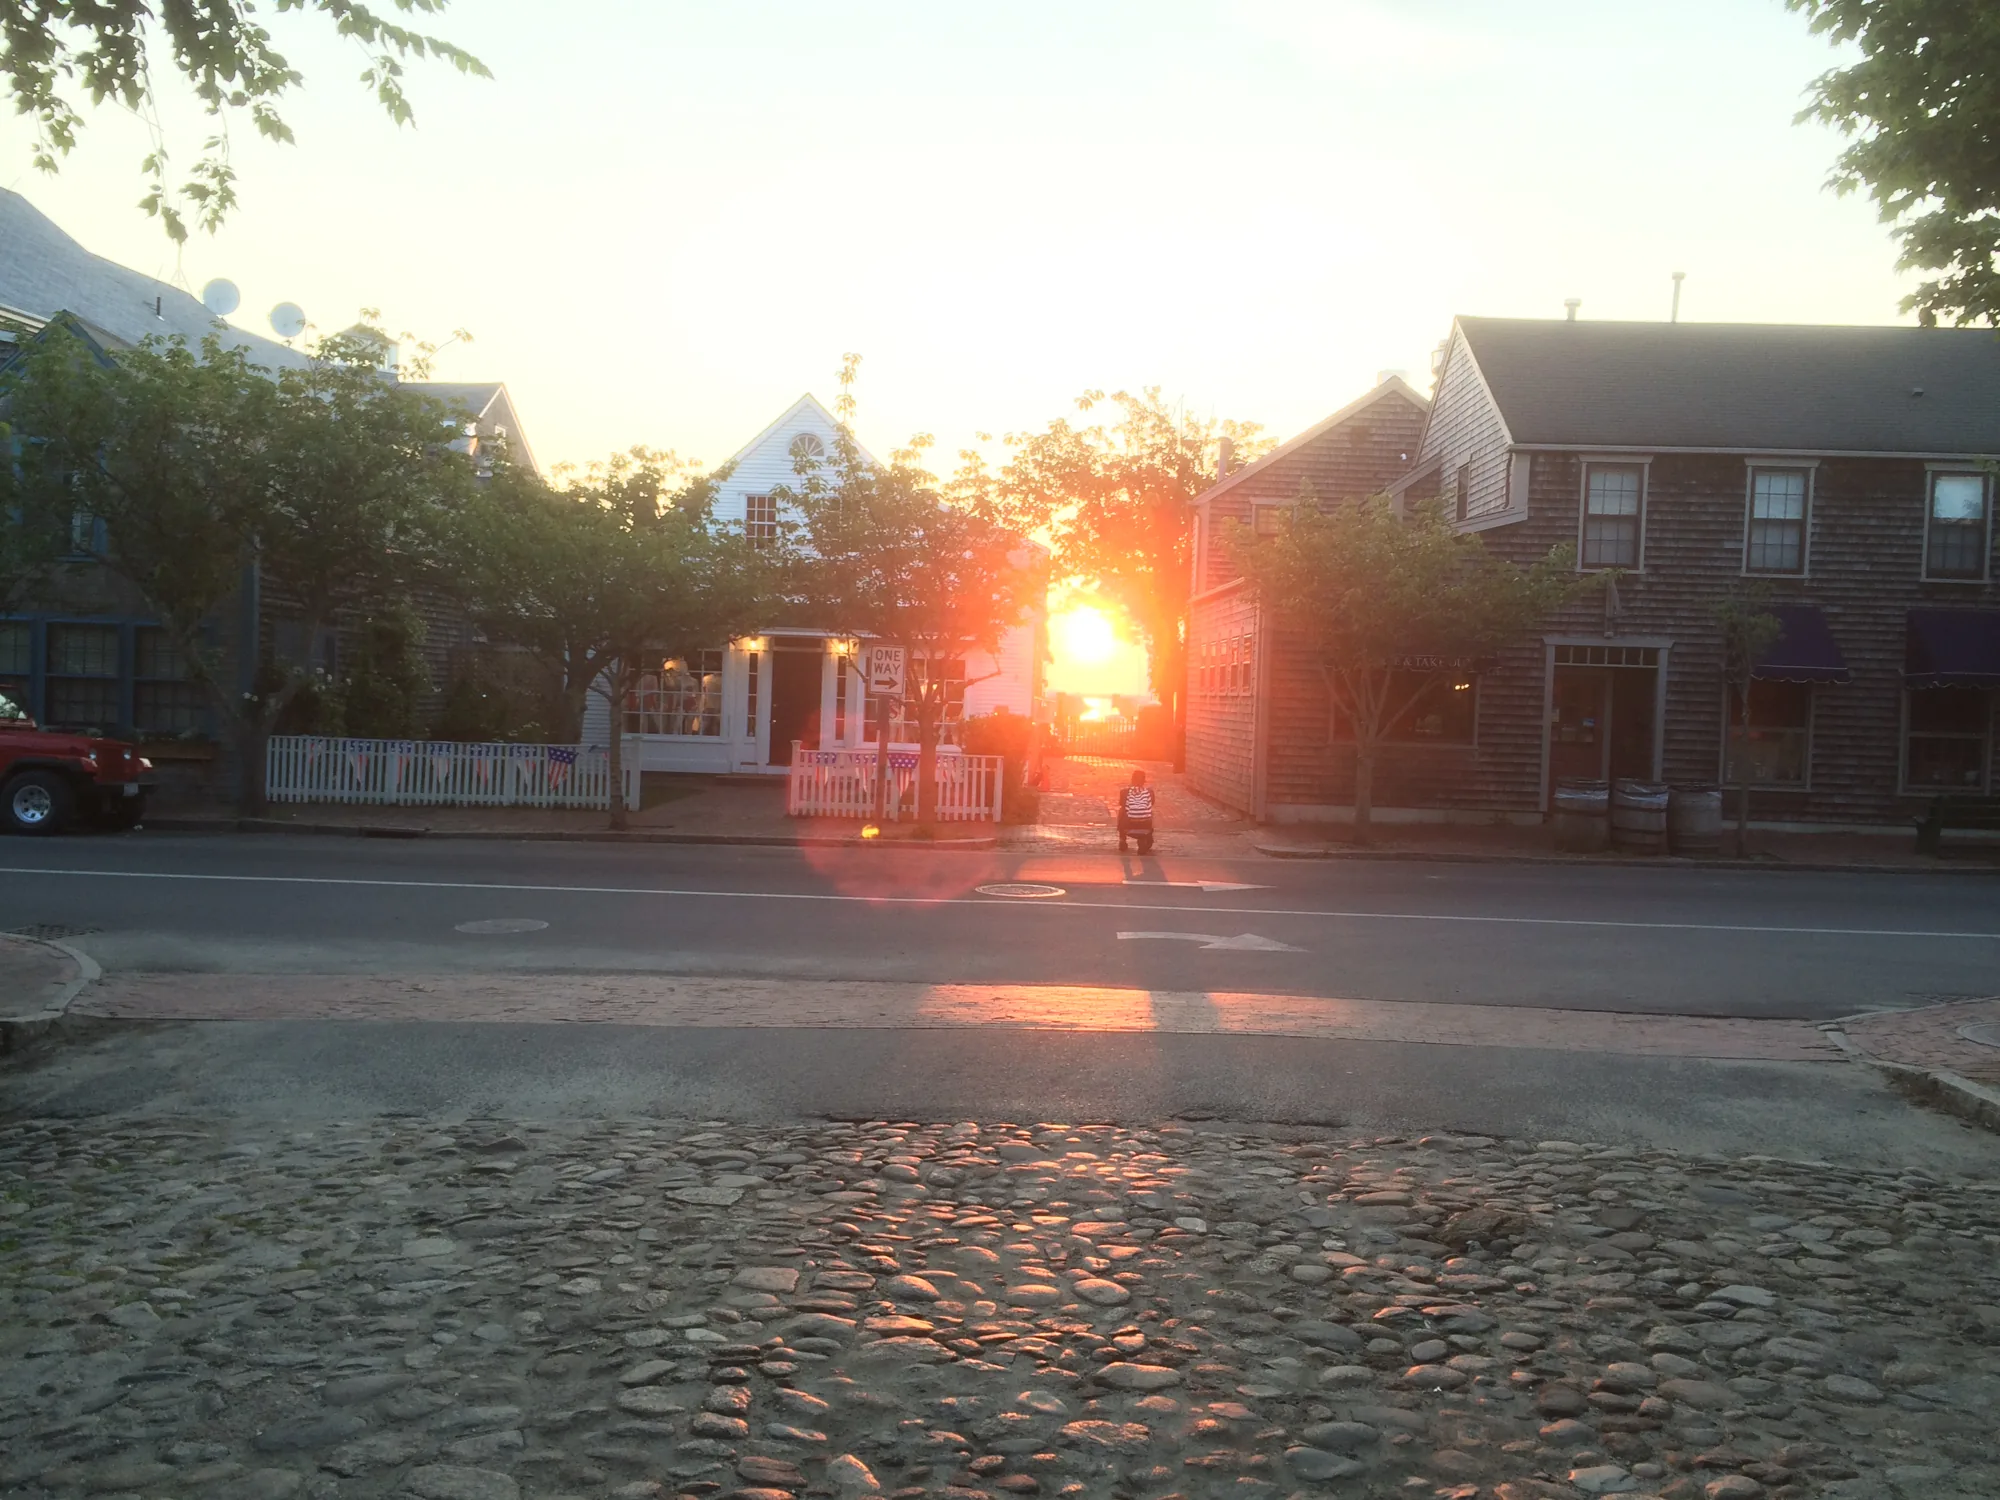
Cobblestone lanes, historic-district homes, and walk-to-everything living.
Downtown Nantucket real estate is the island at its most concentrated — cobblestone streets, gas lamps, and one of the finest surviving collections of pre-Civil War architecture in the country, all within a few walkable blocks of the harbor. When buyers picture Nantucket, this is usually the picture: whale-oil-era captains' houses, rose-trimmed cottages on brick lanes, and the ferry horn carrying up from the wharf. Choosing to live here is less about square footage than about being able to walk out your door into three centuries of history and still make a 7:30 dinner reservation on foot.
The "downtown" area — what LINK's market data files under the Town statistical zone, and what most locals just call in town — runs from the wharves and Main Street up through the residential lanes of the Old Historic District, brushing the edges of Brant Point and the Cliff. It is the densest, most liquid, and most tightly regulated corner of the island's market, and it rewards buyers who understand what they're stepping into.
What downtown Nantucket real estate really means
Downtown Nantucket real estate is not one product — it's a spectrum packed into a small footprint. On the same ten-minute walk you'll pass a grand three-story Greek Revival built by a whaling captain, a half-house cottage from the 1780s that has been added onto four times, a converted commercial building on a lane off Main, and a tucked-away carriage house that never appears in a listing photo. A meaningful slice of this stock trades as condominiums — the condo guide explains why the documents are the property. What ties them together is location: everything here is defined by proximity — to the boats, the restaurants, the galleries, the year-round community that keeps the lights on after the summer crowds leave.
That proximity is exactly what buyers of Nantucket town homes for sale are paying for. You can own a waterfront estate out on the moors and still drive twenty minutes for a quart of milk; downtown, daily life happens on foot. For a certain buyer — someone who wants the island's energy rather than its isolation — nothing else on Nantucket substitutes for it. For another buyer, the same density that makes downtown vibrant in August makes it busier and less private than 'Sconset or Polpis. Knowing which buyer you are is the first real decision — and the 'Sconset-vs-downtown comparison runs that fork honestly. If the trade you're weighing is walkability against everyday practicality instead, Downtown vs. Mid Island is the other fork.
Why buyers choose downtown
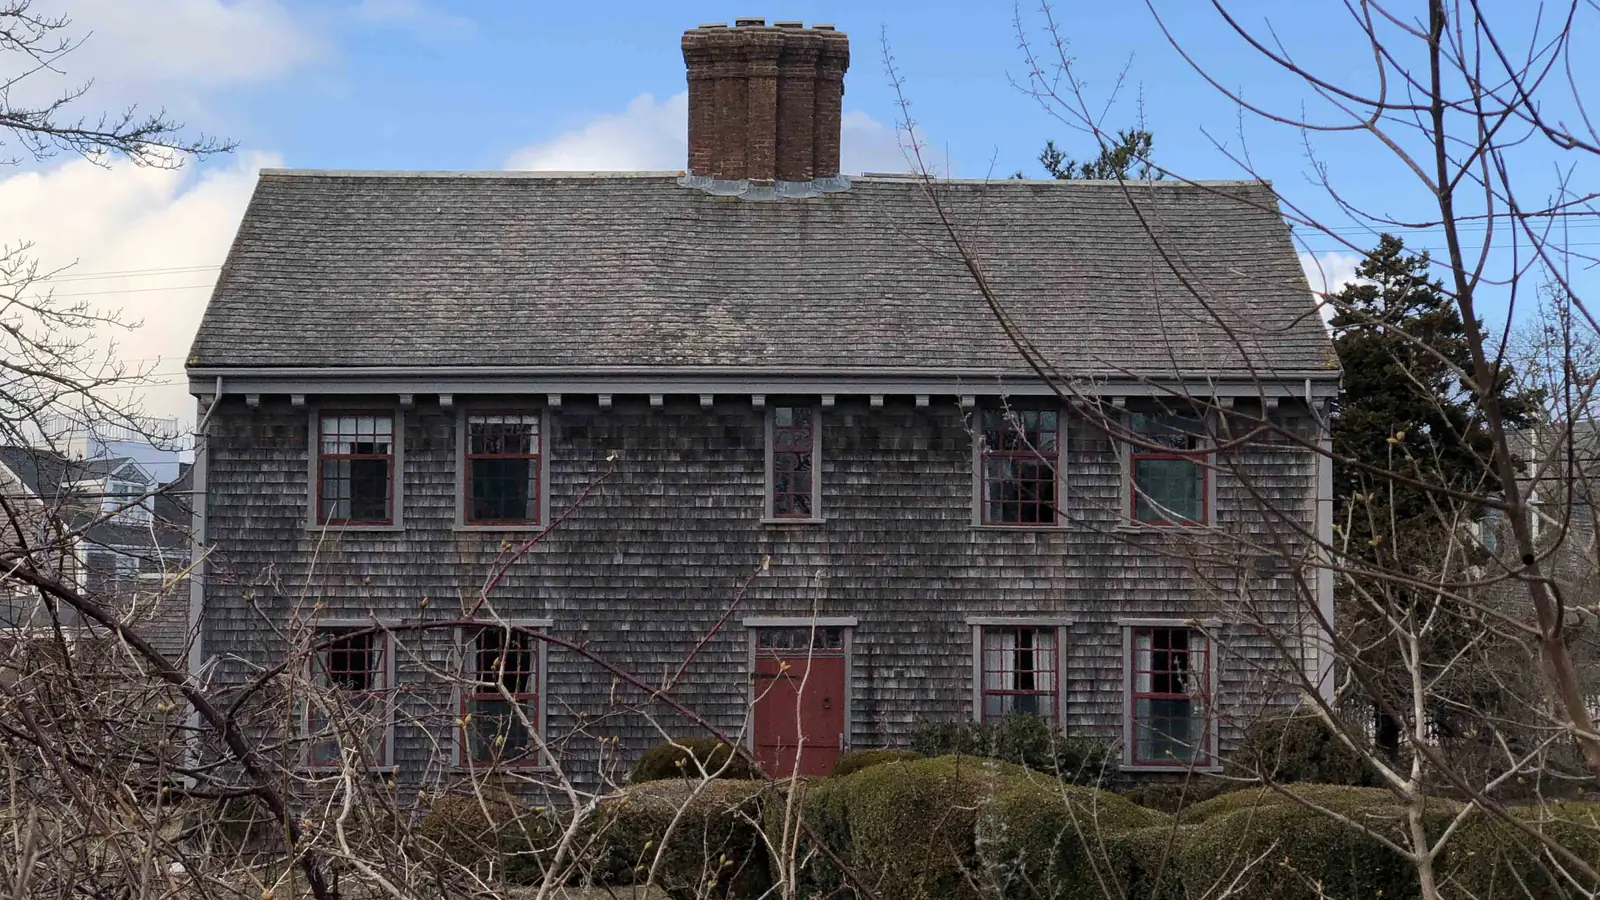
In-town cottages vs. grand captains' houses
The clearest way to understand downtown is to look at the two ends of what it offers, and everything in between.
The captains' houses
The grand addresses — upper Main Street, Orange Street, Pleasant Street, Fair Street — hold the island's most storied homes: Federal and Greek Revival mansions built on whaling fortunes, with the scale, ceiling heights, and provenance to match. These are trophy properties in the truest sense, and they trade rarely. When one comes to market, it draws serious, often national attention, and the buyer is usually acquiring a piece of documented history as much as a residence. The island's antique stock, type by type, is mapped in historic homes.The in-town cottages
On the smaller lanes — the Fish Lots, the streets threading off Centre and India — you'll find the antique half-houses, quarter-houses, and cottages that make up the working fabric of the historic district. Many are compact by modern standards, sit close to their neighbors, and have been renovated repeatedly within the constraints of their footprints. They are the more attainable (a relative word here) way into the core, and for many buyers they're the more livable one.The edges
Where downtown meets Brant Point and the base of the Cliff, lots open up slightly, some homes are newer, and water views enter the picture — while remaining an easy walk to Main Street. These blocks blur the line between "in town" and the neighborhoods just beyond it, and they carry their own flood-zone and price considerations.Historic district homes and what HDC review means for you
Every building on Nantucket sits under the jurisdiction of the Historic District Commission (HDC) — the island is one of the largest National Historic Landmark districts in the country — but nowhere is that oversight more present than downtown. If you're buying historic district homes in the core, HDC review is not a formality to plan around later; it shapes what you can and can't do from the day you close.
In practice, that means anything visible from a public way — rooflines, siding, windows, doors, trim, paint colors, fences, additions, even some landscaping and hardscape — requires HDC approval before work begins. The commission meets on a published schedule, and applications take time. For owners, this cuts two ways. It constrains renovations and can lengthen timelines and budgets, which is a genuine cost. But it is also precisely why the downtown streetscape has stayed remarkably intact for a century, and why value here has proven so durable: the thing you're buying can't be degraded by what a neighbor decides to build next door. Buyers who treat the HDC process as a partner rather than an obstacle tend to be the happiest owners in the core.
The market here
Downtown is the most liquid market on Nantucket — more homes change hands here in a typical year than in any single outlying neighborhood — but "liquid" is relative on an island where a strong quarter still means a handful of sales. That thinness is the single most important thing to understand about pricing in the core: individual quarters swing hard, and no one figure tells the whole story.
The numbers below are drawn from LINK's Q2 2026 Quarterly Sales Summary (the "Town" statistical area, single- and multi-family):
- Q2 2026: 10 sales, median sale price $2,797,500, average $3,537,750, roughly $35.4M in volume, with homes taking on the order of eight to ten months from listing to close.
- Year to date through Q2 2026: about 19 residential sales in the Town area, roughly $80M in residential volume.
Now the honest part — look at how the same Q2 median has moved year to year in the Town area, and you'll see why a single median is a weak guide:
| Q2 (Town, single/multi-family) | Sales | Median sale price |
|---|---|---|
| 2022 | 11 | $3,164,165 |
| 2023 | 12 | $3,100,000 |
| 2024 | 9 | $4,225,000 |
| 2025 | 5 | $3,950,000 |
| 2026 | 10 | $2,797,500 |
Source: LINK Q2 2026 Quarterly Sales Summary, Town section.
The 2026 median didn't drop because downtown got cheaper — it moved because the mix of what sold shifted toward more cottages and fewer trophy captains' houses that quarter. With sample sizes this small, the composition of a handful of sales moves the median more than any underlying trend does. That's the whole point: in a market this thin and this varied, a current, property-specific read is worth far more than a headline number pulled from a report. For the island-wide picture, see the full market report; for where downtown fits, a five-minute call will tell you more than any table.
47 homes sold here this year, at a $4.20M median
From January 1 through September 2026, LINK Nantucket recorded 47 home sales filed under Town, from $1,250,000 to $9,950,000. The median was $4,200,000, 14% above the island-wide home median of $3,700,000 over the same months.
Nine of the 47 show no marketing period in LINK: they were recorded at their sale price, which is how a private sale enters the record. The 38 that were publicly listed sold for 87.8% to 116.1% of their asking prices, after 3 to 499 days on the market.
LINK files the neighboring districts under their own names, so they are not in the count above: Brant Point (4 sales, $5,722,500 median); Cliff (9 sales, $5,600,000 median); West of Town (8 sales, $3,047,500 median).
| Address | Type | Beds | Living area | Sale price | Sold vs. asking | Days on market | Closed |
|---|---|---|---|---|---|---|---|
| 3 Pleasant Street | House | 3 | 2,834 sq ft | $7,240,000 | 100.5% | 3 | 9/25/26 |
| 8 Ash Street | House | 5 | 4,992 sq ft | $9,100,000 | 100.0% | 4 | 9/18/26 |
| 10B Angola Street | House | 3 | 2,814 sq ft | $3,999,000 | 93.1% | 103 | 9/16/26 |
| 4 Sunset Hill Lane | House | 5 | 2,825 sq ft | $4,900,000 | 98.1% | 169 | 9/16/26 |
| 17 Gay Street | House | 4 | 2,246 sq ft | $2,950,000 | 91.5% | 84 | 9/15/26 |
| 4 Gay Street | House | 4 | 4,280 sq ft | $8,500,000 | 95.0% | 99 | 9/15/26 |
| 6 Gull Island Lane | House | 6 | 3,734 sq ft | $9,375,000 | 96.4% | 114 | 9/15/26 |
| 10 Silver Street | House | 8 | 5,264 sq ft | $6,250,000 | 96.2% | 106 | 9/14/26 |
| 12 Atlantic Avenue | House | 7 | 3,111 sq ft | $1,700,000 | — | Off-market | 9/4/26 |
| 1 Beaver Street | House | 2 | 1,078 sq ft | $1,995,000 | 100.0% | 50 | 9/2/26 |
| 32 Union Street | House | 5 | 3,366 sq ft | $6,245,000 | 94.7% | 111 | 9/2/26 |
| 42B Union Street | House | 3 | 2,100 sq ft | $4,200,000 | 97.8% | 56 | 9/1/26 |
| 18 Mill Street | House | 6 | 4,930 sq ft | $6,300,000 | 95.5% | 355 | 9/1/26 |
| 157 Main Street | Condo | 4 | 2,210 sq ft | $3,650,000 | — | Off-market | 8/31/26 |
| 16 India Street | House | 3 | 2,326 sq ft | $8,000,000 | 97.6% | 18 | 8/31/26 |
| 10 Still Dock | House | 2 | 1,425 sq ft | $5,000,000 | — | Off-market | 8/28/26 |
| 40 Center Street # B | Condo | 1 | 388 sq ft | $1,600,000 | — | Off-market | 8/25/26 |
| 8 & 10 Sea Street | House | 2 | 1,832 sq ft | $6,550,000 | — | Off-market | 8/25/26 |
| 15 North Water Street | House | 6 | 5,100 sq ft | $9,950,000 | 99.5% | 83 | 8/25/26 |
| 35 Pine Street | House | 4 | 2,259 sq ft | $3,995,000 | — | Off-market | 8/20/26 |
| 23 Liberty Street | House | 5 | 3,262 sq ft | $4,200,000 | — | Off-market | 7/31/26 |
| 6 Mariner Way | House | 5 | 3,024 sq ft | $5,250,000 | 95.5% | 235 | 7/31/26 |
| 27 North Liberty Street | House | 4 | — | $4,475,000 | 97.4% | 259 | 7/24/26 |
| 4 Red Mill Lane | House | 5 | 4,012 sq ft | $5,862,000 | 91.7% | 173 | 7/24/26 |
| 4 Crown Court | House | 5 | 3,900 sq ft | $5,150,000 | 93.7% | 51 | 7/14/26 |
| 1 Saratoga Lane | House | 3 | 2,620 sq ft | $3,250,000 | 116.1% | 5 | 7/2/26 |
| 33 Pine Street | House | 5 | 3,020 sq ft | $3,500,000 | 94.6% | 247 | 7/2/26 |
| 24 Milk Street | House | 3 | 1,070 sq ft | $2,985,000 | 94.8% | 5 | 7/1/26 |
| 10 Coffin Street | House | 3 | 1,310 sq ft | $2,445,000 | 102.1% | 8 | 6/23/26 |
| 19 Orange Street | House | 4 | 2,678 sq ft | $4,112,500 | 92.4% | 499 | 6/18/26 |
| 52 Pleasant Street | House | 4 | 1,232 sq ft | $2,150,000 | 95.8% | 281 | 6/15/26 |
| 9 Pleasant Street | House | 5 | 5,301 sq ft | $9,650,000 | 87.8% | 373 | 6/12/26 |
| 96A Pleasant Street # 1.1 & 1.2 | Condo | 1 | 485 sq ft | $1,250,000 | — | Off-market | 6/9/26 |
| 34 Pine Street | House | 3 | 1,565 sq ft | $2,325,000 | 93.2% | 288 | 6/8/26 |
| 4 Eagle Lane | House | 4 | 1,722 sq ft | $2,945,000 | — | Off-market | 6/1/26 |
| 6 Eagle Lane | House | 3 | 1,088 sq ft | $2,300,000 | 92.2% | 184 | 5/30/26 |
| 42 North Liberty Street | House | 2 | 1,295 sq ft | $2,650,000 | 91.5% | 26 | 5/29/26 |
| 15 Old North Wharf | House | 2 | 880 sq ft | $3,800,000 | 96.2% | — | 5/22/26 |
| 85R Orange Street | House | 4 | 2,550 sq ft | $3,000,000 | 88.4% | 247 | 5/19/26 |
| 26 Milk Street (Lot 1) | House | 5 | 3,100 sq ft | $3,700,000 | 97.4% | 103 | 3/31/26 |
| 25C Pine Street | House | 4 | 3,070 sq ft | $4,800,000 | 92.4% | 174 | 3/30/26 |
| 10 Milk Street | House | 6 | 4,332 sq ft | $5,075,000 | 92.3% | 101 | 3/26/26 |
| 32 India Street | House | 5 | 5,394 sq ft | $8,100,000 | 92.6% | 168 | 3/12/26 |
| 22 Vestal Street | House | 6 | 4,000 sq ft | $5,100,000 | 92.9% | 193 | 2/20/26 |
| 51 North Liberty Street | House | 6 | 1,788 sq ft | $2,550,000 | 98.3% | 85 | 2/10/26 |
| 36 West Chester Street | House | 5 | 5,600 sq ft | $7,300,000 | 93.6% | 134 | 1/30/26 |
| 21.5 Hussey Street | House | 5 | 3,800 sq ft | $6,900,000 | 94.6% | 33 | 1/7/26 |
Source: LINK Nantucket Sales History, January–September 2026, every closing filed under Town. Homes are counted the way LINK counts them (houses, condos and multi-family), the same 184 sales behind the island-wide median on the market report. Bedrooms and living area come from LINK's sold-listing records; "off-market" marks a sale LINK shows with no marketing period and an asking price equal to its sale price. Every district side by side: the neighborhood table. Every island sale: recent home sales.
Land trades here too. One lot closed under Town through September 2026, at $1,837,500.
| Address | Lot size | Sale price | Sold vs. asking | Days on market | Closed |
|---|---|---|---|---|---|
| 123 Orange Street | 0.14 acres | $1,837,500 | — | Off-market | 9/18/26 |
Source: LINK Nantucket Sales History, Land section, every 2026 closing filed under Town. Lot sizes come from LINK's sold-listing records.
Buying downtown: what to know
Historic District Commission
Flood zones & the harbor edge
Parking & outdoor space
Short-term rental rules & scarcity
Downtown Nantucket homes for sale
All downtown listings →24 active · $1,999,000 – $32,000,000 · median ask $6,747,450 · 16 houses · 2 land · 3 condos · 3 other
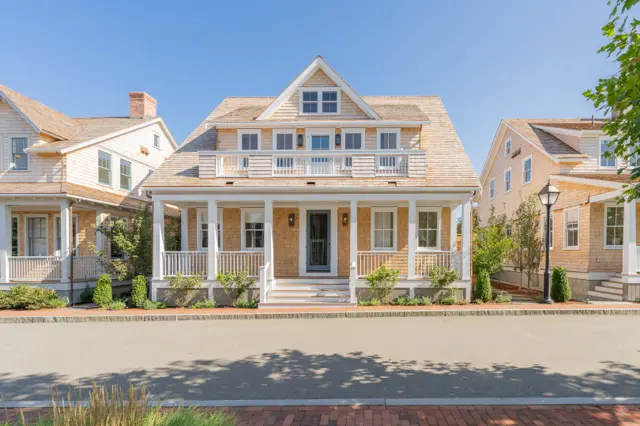
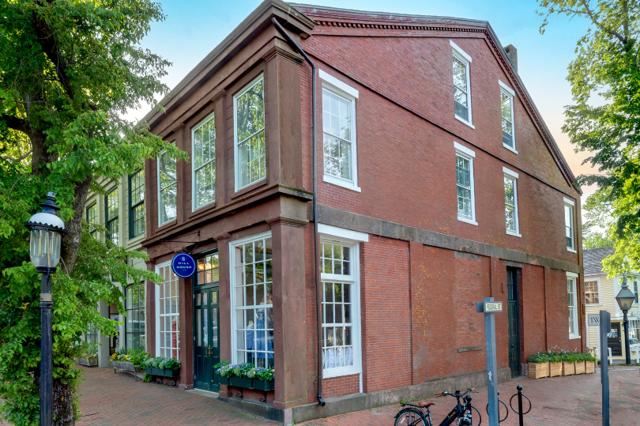
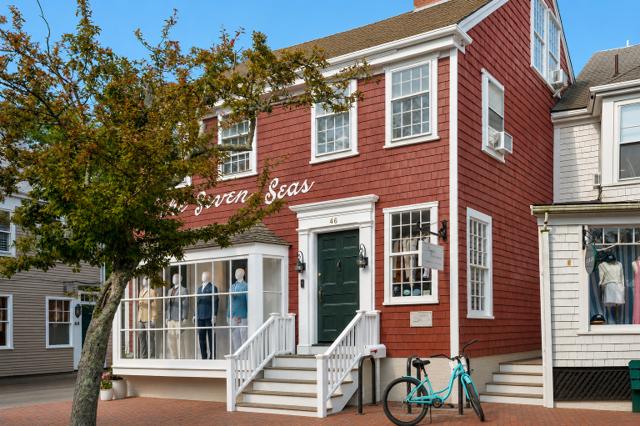
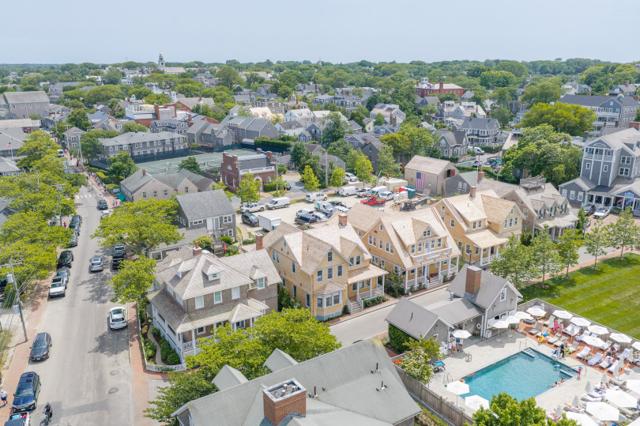
Live from the Nantucket MLS · updated October 17, 2026
Downtown Nantucket — the questions I get
What have Town homes sold for in 2026?
Through September 2026, LINK Nantucket recorded 47 home sales in Town, from $1,250,000 to $9,950,000, with a median of $4,200,000. The island-wide home median over the same months was $3,700,000. Nine of the 47 show no marketing period in LINK: they were recorded at their sale price, which is how a private sale enters the record. The 38 that were publicly listed sold for 87.8% to 116.1% of their asking prices, after 3 to 499 days on the market. Each sale is listed on this page.What counts as "downtown" on Nantucket?
Locally, it's the historic core — Main Street and the wharves up through the residential lanes of the Old Historic District, brushing the edges of Brant Point and the base of the Cliff. In LINK's market data it's the "Town" statistical area. There are no hard borders, but the feel is unmistakable: if you can walk to the wharf and everything around you is under close Historic District review, you're downtown.Is downtown a year-round neighborhood or a summer one?
Both, and that's part of its appeal. Downtown has the island's most genuine year-round community — the people who keep restaurants, shops, and institutions running through the off-season — layered under the summer crowds. It's livelier in the shoulder seasons than most of the island, which some buyers love and others find busier than they expected.What does it cost to buy downtown?
It spans widely, from compact in-town cottages to grand captains' houses in the millions. LINK's Q2 2026 data put the Town-area median around $2.8M on ten sales that quarter, but that figure swings hard from quarter to quarter depending on what actually sold. I'd rather give you a current, honest read for the specific kind of property you have in mind than point you at a median that a single trophy sale could double.What is the Historic District Commission and will it affect my renovation?
Yes — assume it affects any exterior work. The HDC reviews changes visible from a public way: rooflines, siding, windows, doors, trim, paint, fences, additions, and more. It protects the streetscape and your long-term value, but it adds time and process to renovations. Plan for it from the start rather than discovering it mid-project.Are downtown homes in a flood zone?
The lower blocks near the harbor and toward Brant Point can be. Flood-zone status affects insurance and what you can build or rebuild, so it's a due-diligence item on any property near the water's edge. Homes higher up the historic streets generally aren't, but it's always worth confirming property by property.How's parking downtown?
Tight. Off-street parking is scarce and valuable — a deeded space or private driveway is a real asset that shows up again at resale. It's one of the practical details that separates two otherwise similar in-town homes.Can I rent my downtown home short-term?
Downtown has some of the strongest rental demand on the island, but Nantucket's short-term rental rules are evolving. If rental income is part of your plan, we should look at the current regulations and the specific property before you count on any numbers.Why is downtown inventory so limited if it's the most active market?
It's the most active in absolute terms — more sales than any single outlying neighborhood — but the core is small and largely built out, and the best streets turn over rarely. A lot of it trades quietly, off-market, between people who already know the block. That's why being early and connected matters more here than almost anywhere else on the island.Thinking about buying downtown?
Sean Kalman is a sixth-generation Nantucketer who knows the island the way only a native can — its neighborhoods, its seasons, and the difference between visiting and truly living here. Through The Kalman Co. (brokered by eXp Realty), he pairs a hospitality background with sharp market insight, guiding buyers and sellers with calm, concierge-level service from Town to 'Sconset to Madaket. sean@thekalmanco.com · thekalmanco.com
Sean Kalman, REALTOR® · The Kalman Co., brokered by eXp Realty. Equal Housing Opportunity.